> ## Documentation Index
> Fetch the complete documentation index at: https://academy.pathfindr.ai/llms.txt
> Use this file to discover all available pages before exploring further.
# Check Copilot Usage Across Your Business
> Learn how to access and use Microsoft 365 Copilot usage reports to measure adoption and drive value.
## Getting started
### Have the right permission settings
Starting off you want to make sure IT has given you the following permission settings:
**Required permissions checklist:**
* Report reader
* AI Administrator
* Insights Analyst
* Insights Administrator
**Minimum for basic usage reports:** Reports Reader or AI Administrator.
**Full access to all dashboards:** Global Administrator + Insights Administrator + Insights Analyst.
## Microsoft 365 Copilot Usage Reports
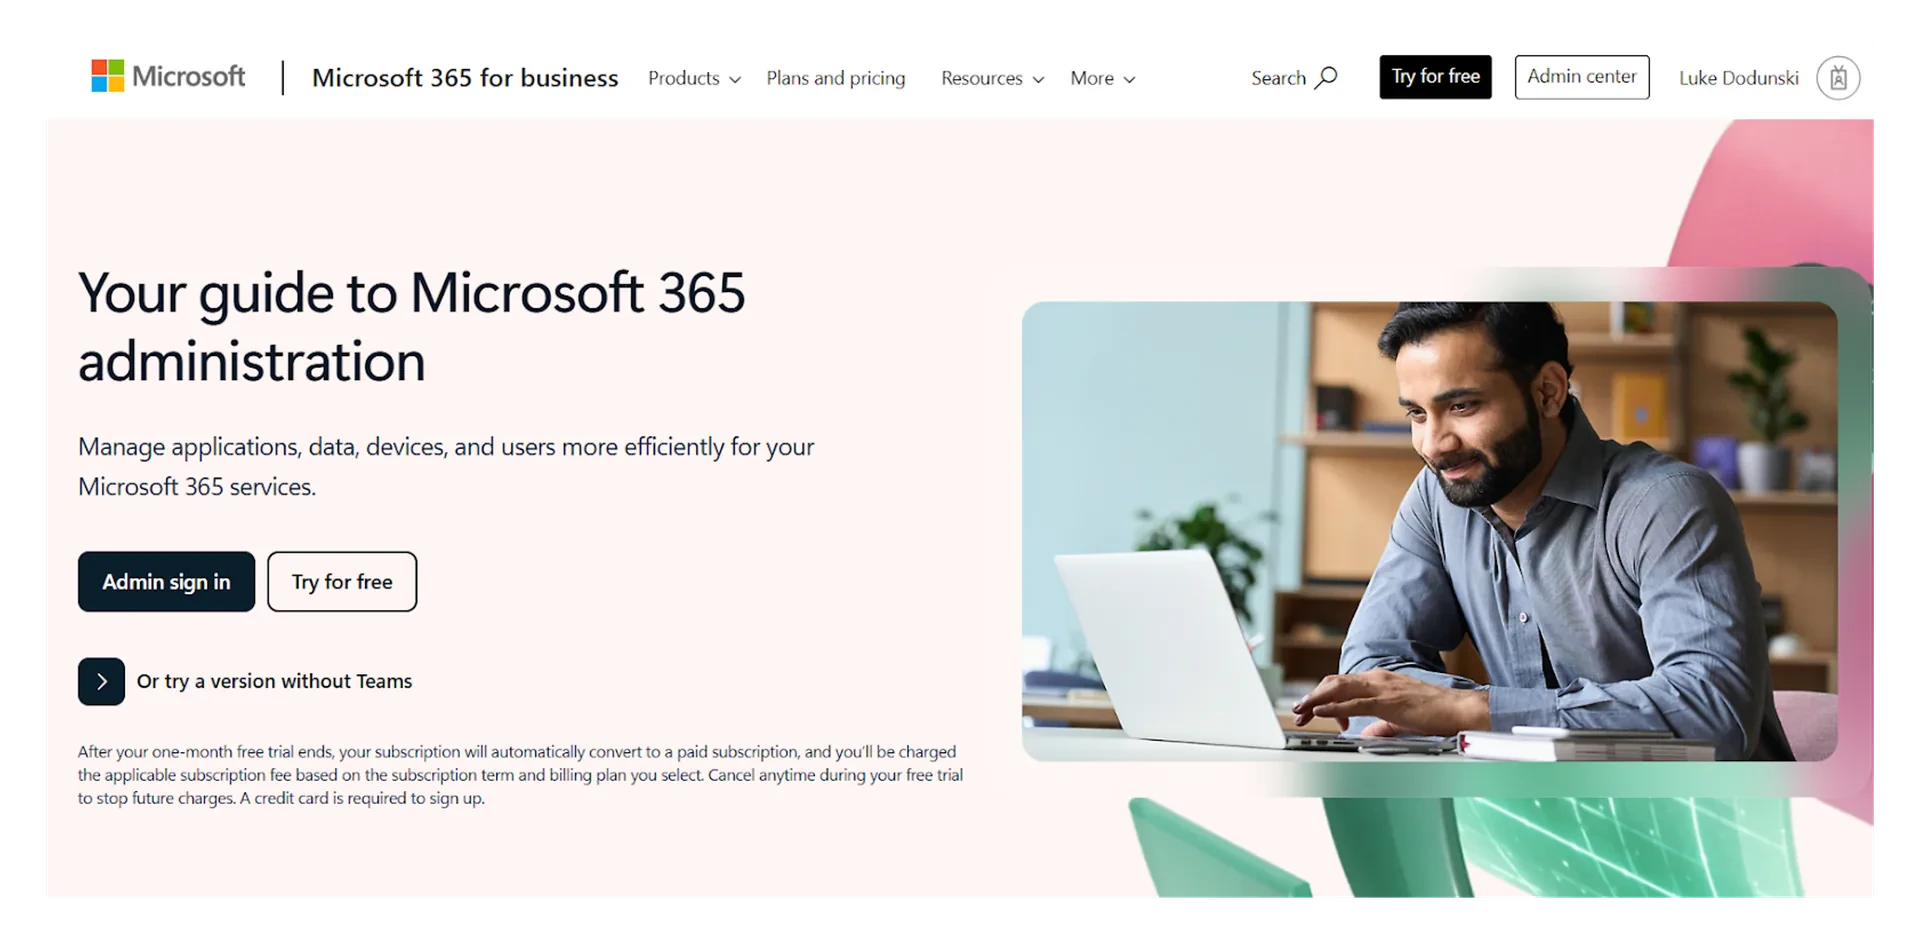
Once you have the right permission settings go through Microsoft 365 Copilot Usage Reports in the admin centre. Navigate to this link to sign in to admin centre: [Click here](https://www.microsoft.com/en-gb/microsoft-365/business/microsoft-365-administration).
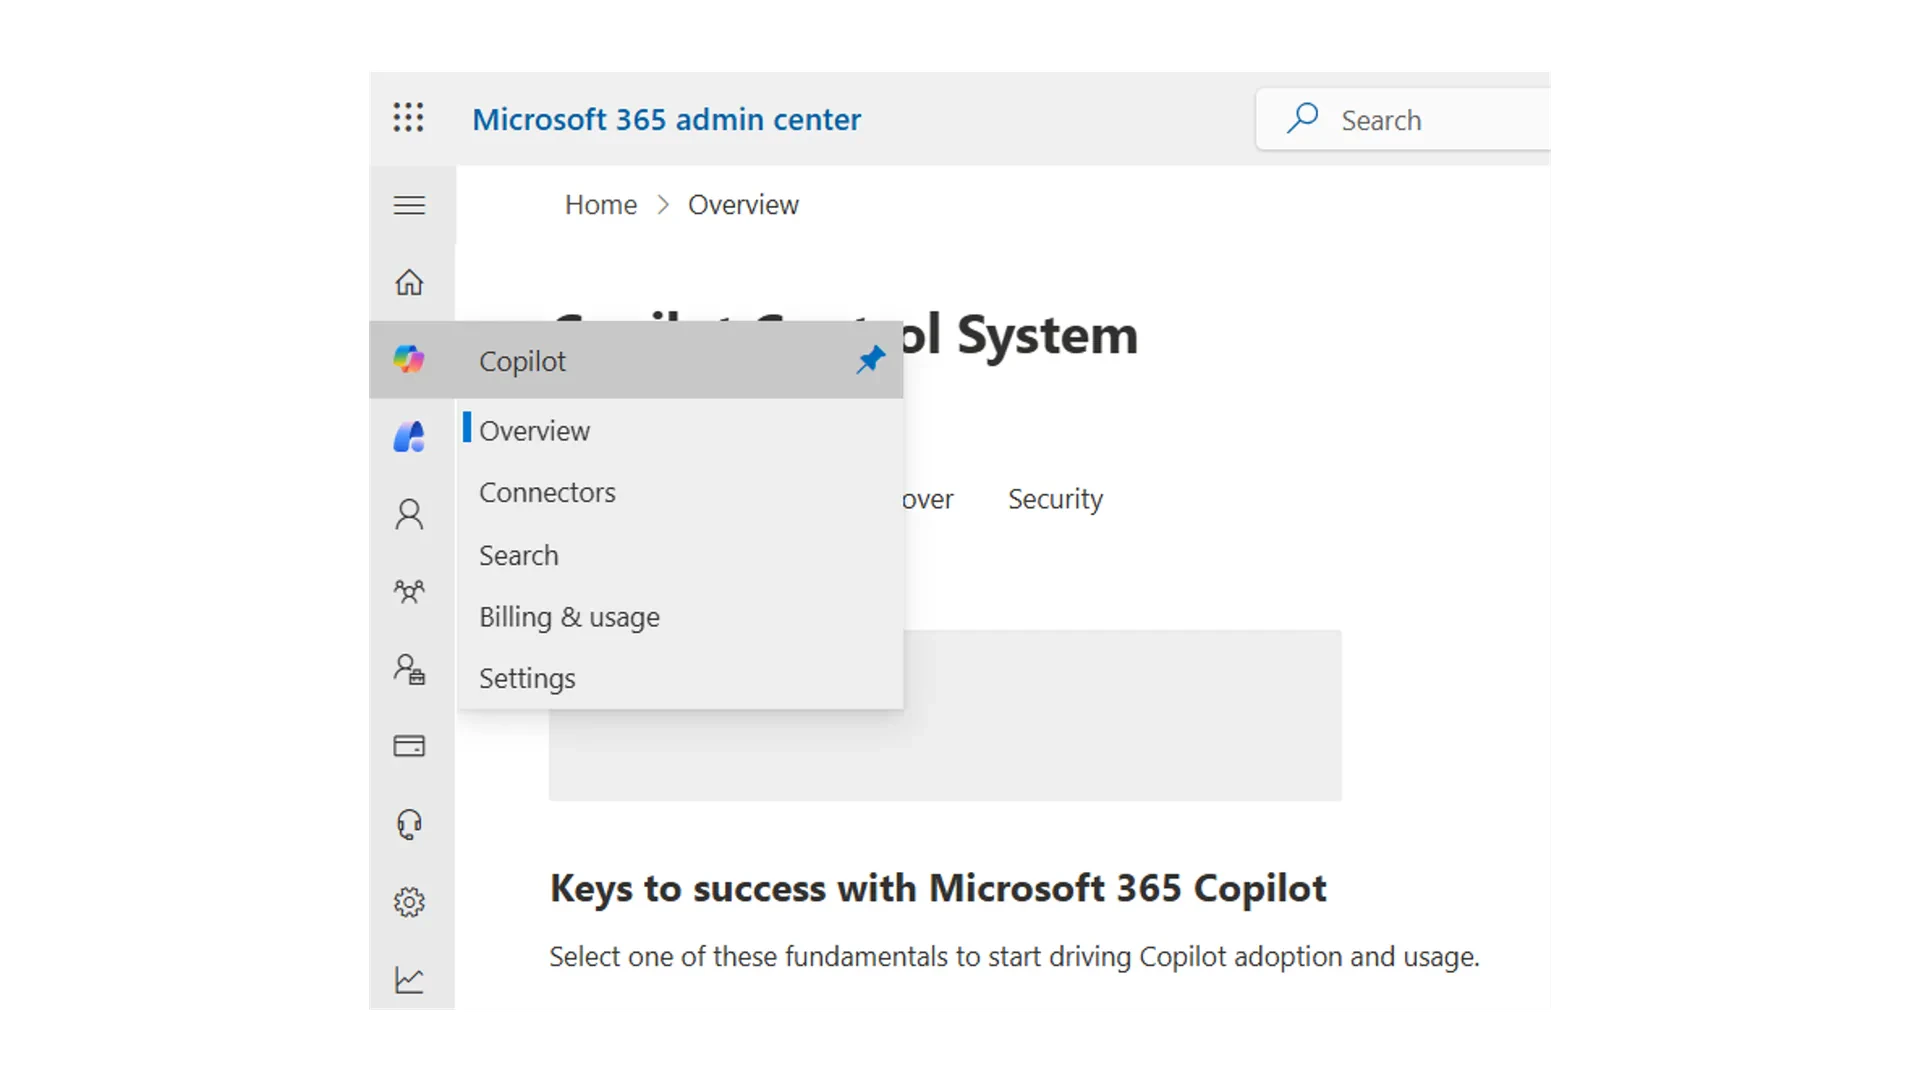
 Once in admin centre navigate to Copilot, then choose Overview. [Click here for detailed overview.](https://learn.microsoft.com/en-us/microsoft-365/admin/activity-reports/microsoft-365-copilot-usage?view=o365-worldwide)
 ## What should you start measuring
Within the Microsoft 365 Copilot Usage Reports (Admin Center) we would recommend starting to understand the following measures:
Total number of unique users with Copilot licenses.
Number of enabled users who initiated a Copilot feature in any Microsoft 365 app.
Ratio of active users to enabled users.
Number of prompts sent to Copilot Chat.
Users who interacted with custom agents built by your organization.
Starting with these metrics ensures clarity on adoption progress. **Active Users** and **Active User Rate** reveal real engagement, while **Trend Over Time** shows momentum. **Prompts Submitted** indicates depth of usage, and **Enabled Users** confirms readiness. Together, they provide a baseline for targeting enablement and driving Copilot value.
### Five best practice tips for the Usage Reports
Focus on these first because they show real adoption and engagement versus license assignment.
Use 30 or 90-day views to spot momentum and seasonal patterns.
High prompt counts indicate deeper usage; low counts suggest training gaps.
Check Enabled Users regularly to ensure all intended users are provisioned.
Usage alone does not show impact; pair with productivity benchmarks for richer insights.
## Advanced reporting options beyond Admin Center
To move beyond the basic Microsoft 365 Copilot Usage Reports in the Admin Center and get advanced reporting and insights, here are your options:
* Provides richer organizational insights like productivity benchmarks, collaboration patterns, and adoption trends by department.
* Requires **Insights Premium license** and admin permissions.
* Connect Copilot usage data to Power BI templates for custom dashboards.
* Allows segmentation by role, geography, and app usage.
* Requires Power BI Pro and access to Microsoft Graph data.
* Pull raw usage data for deeper analysis or integration with enterprise BI tools.
* Requires **Graph API permissions** and developer support.
[Click here to learn more](https://learn.microsoft.com/en-us/viva/insights/copilot-analytics-introduction) about accessing advanced reporting and Viva Insights.
## What should you start measuring
Within the Microsoft 365 Copilot Usage Reports (Admin Center) we would recommend starting to understand the following measures:
Total number of unique users with Copilot licenses.
Number of enabled users who initiated a Copilot feature in any Microsoft 365 app.
Ratio of active users to enabled users.
Number of prompts sent to Copilot Chat.
Users who interacted with custom agents built by your organization.
Starting with these metrics ensures clarity on adoption progress. **Active Users** and **Active User Rate** reveal real engagement, while **Trend Over Time** shows momentum. **Prompts Submitted** indicates depth of usage, and **Enabled Users** confirms readiness. Together, they provide a baseline for targeting enablement and driving Copilot value.
### Five best practice tips for the Usage Reports
Focus on these first because they show real adoption and engagement versus license assignment.
Use 30 or 90-day views to spot momentum and seasonal patterns.
High prompt counts indicate deeper usage; low counts suggest training gaps.
Check Enabled Users regularly to ensure all intended users are provisioned.
Usage alone does not show impact; pair with productivity benchmarks for richer insights.
## Advanced reporting options beyond Admin Center
To move beyond the basic Microsoft 365 Copilot Usage Reports in the Admin Center and get advanced reporting and insights, here are your options:
* Provides richer organizational insights like productivity benchmarks, collaboration patterns, and adoption trends by department.
* Requires **Insights Premium license** and admin permissions.
* Connect Copilot usage data to Power BI templates for custom dashboards.
* Allows segmentation by role, geography, and app usage.
* Requires Power BI Pro and access to Microsoft Graph data.
* Pull raw usage data for deeper analysis or integration with enterprise BI tools.
* Requires **Graph API permissions** and developer support.
[Click here to learn more](https://learn.microsoft.com/en-us/viva/insights/copilot-analytics-introduction) about accessing advanced reporting and Viva Insights.