Use visuals to get more from Claude
Claude is known for writing and reasoning, but it also has powerful visual capabilities. You can upload photos of whiteboards to transcribe text, share screenshots for analysis, or ask Claude to generate interactive visual mockups and flowcharts using Artifacts. These visual features are built directly into the Claude chat interface, allowing you to seamlessly mix text, images, and code generation in a single workspace. This page will show you how to:Extract text from images
Transcribe handwritten notes, whiteboards, or printed documents
Upload and analyse data
Share a photo of a chart or dashboard and let Claude summarise it
Generate interactive UIs
Use Artifacts to build React components, SVG graphics, and interactive dashboards
Iterate on visuals
Refine generated diagrams or charts with feedback and follow-up prompts
Meet Artifacts in Claude
When you ask AI chatbots to describe a process or build a tool, they usually reply with long blocks of text or raw code. Artifacts change this. When you ask Claude to generate something visual—like a UI mockup, a flowchart, or a custom graphic—it opens a dedicated, interactive window next to your chat. Artifacts are standalone pieces of content that you can view, edit, and interact with in real time. They are perfect for when you need a visual representation of your ideas, not just an explanation.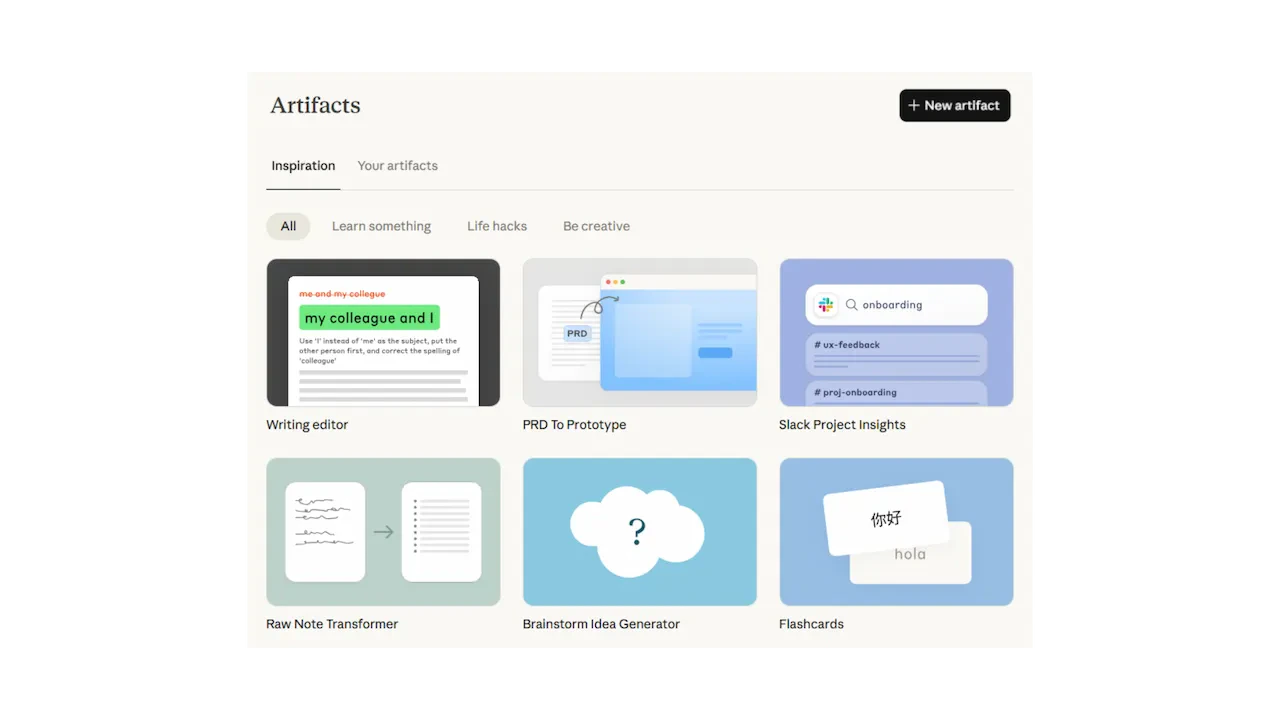
Normal chat
Type a prompt, get text or raw code back. Good for quick questions, drafting emails, or simple analysis. The output is static and requires you to copy/paste code to see it working.
Artifacts
A dedicated visual workspace. Claude instantly renders interactive React components, Mermaid flowcharts, SVG illustrations, and HTML pages alongside your chat.
Interactive UIs
Build functional mockups. Ask Claude to “create a dashboard layout for a sales team” and use the interactive sliders and buttons it generates.
Diagrams & Flowcharts
Visualise processes. Ask Claude to turn a complex written procedure into a clear Mermaid flowchart or architecture diagram.
Custom Graphics
Generate scalable vector graphics (SVG). Ask for icons, logos, or geometric illustrations directly in the chat window.
Upload a photo and ask Claude about it
You can share an image with Claude and ask questions about it or have it extract information. Click the attachment icon (paperclip) in the chat bar, upload a photo from your device, and type your instructions. Claude is exceptional at reading text in images (Optical Character Recognition, or OCR) and understanding the spatial relationships in diagrams.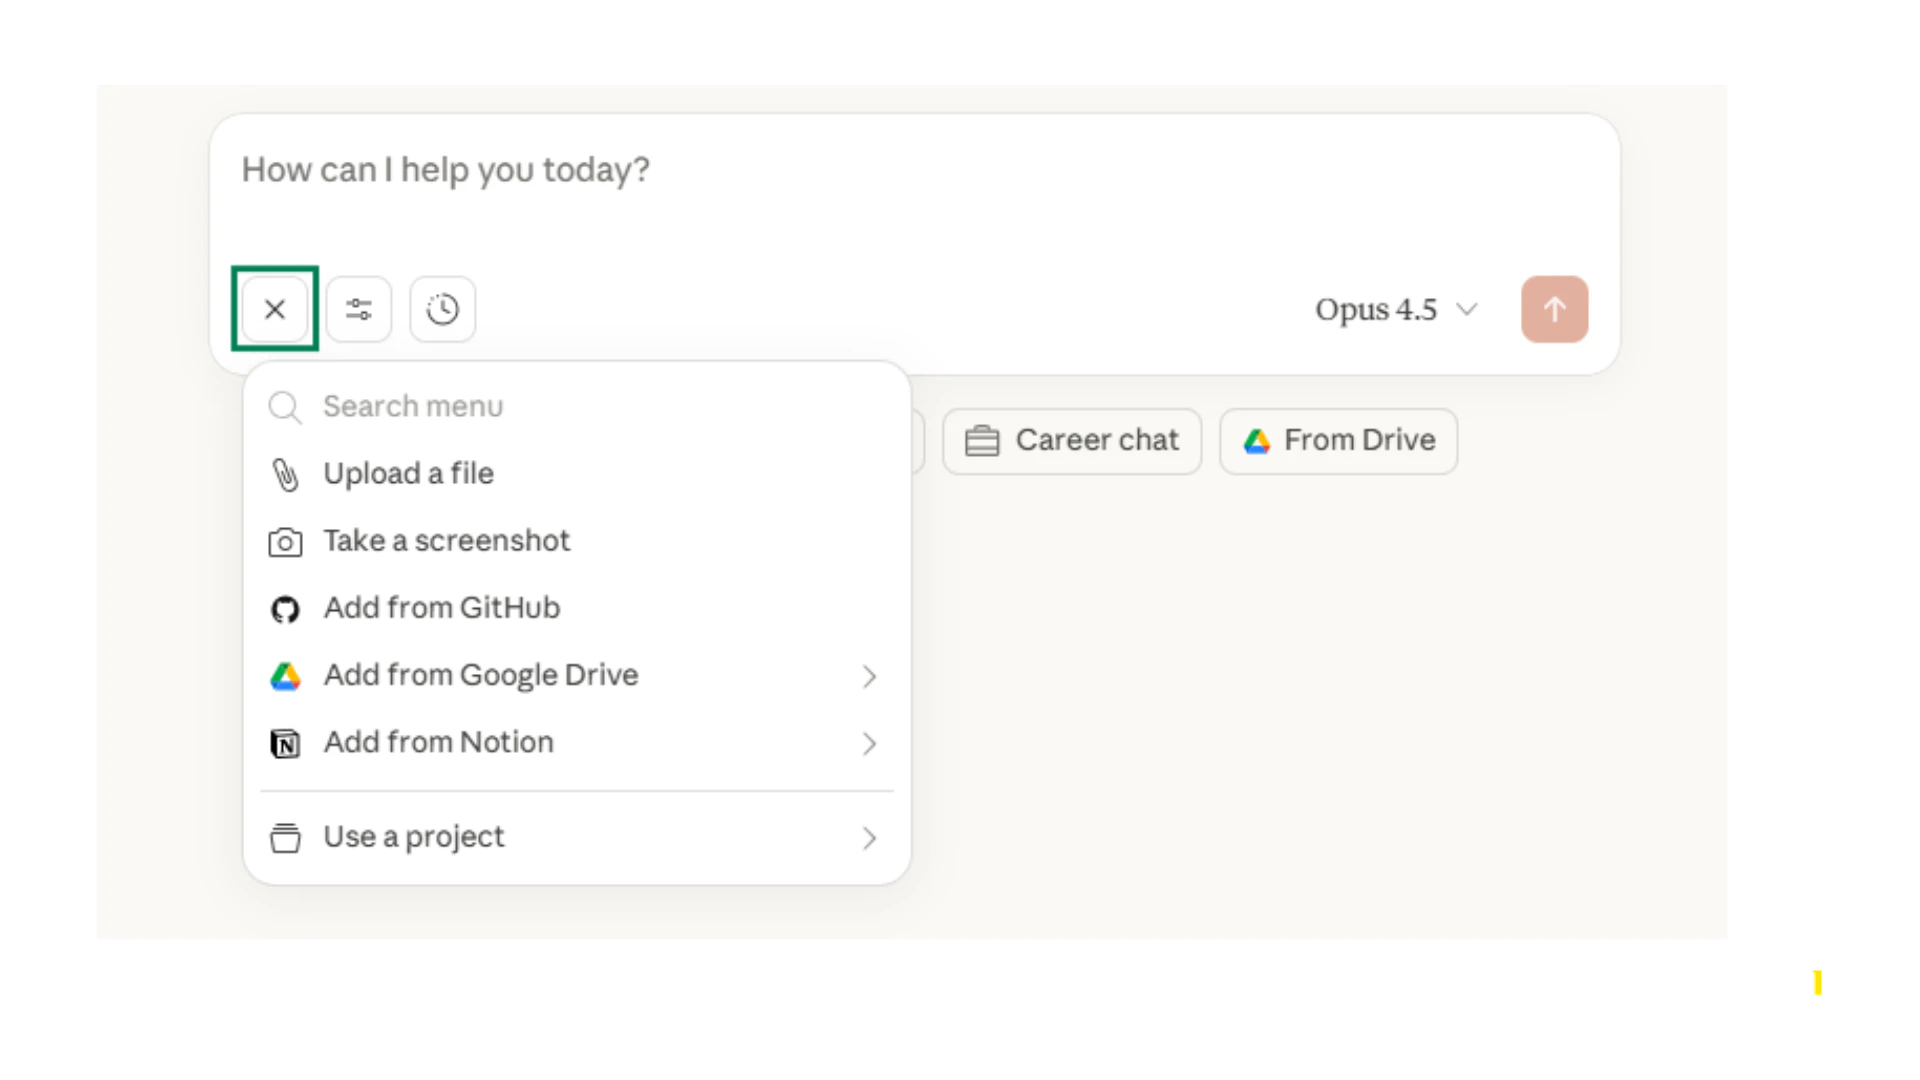
Transcribe handwriting
Snap a photo of your handwritten meeting notes or a brainstorm session on a whiteboard. Ask Claude to transcribe the text into a clean list.
Analyse complex charts
Upload a screenshot of a dense graph or dashboard. Ask Claude to identify the key trends or spot anomalies in the data.
Extract data from tables
Take a photo of a printed table or receipt. Ask Claude to pull the data and format it securely as a CSV or markdown table.
What file types can I upload?
What file types can I upload?
Claude accepts JPEG, PNG, GIF, and WEBP images. The maximum file size per image is 5 MB. You can upload up to 5 images at a time to compare them or extract details across multiple files.
Can I transcribe languages other than English?
Can I transcribe languages other than English?
Yes, Claude’s vision capabilities support text extraction and transcription in many different languages, including complex character sets.
What happens to my uploaded images?
What happens to my uploaded images?
Files are temporarily uploaded to process your request. Always follow your organisation’s data governance policies, especially when uploading images containing confidential information or Personally Identifiable Information (PII).
Iterate on visual concepts
Whether you are generating an interactive dashboard mockup with Artifacts or asking Claude to analyse a chart, the first result is just a starting point. Claude is a conversational assistant, which means you can continuously refine your visuals through follow-up prompts. Here is how to get the most out of iterative prompting with visuals:1
Start with a broad request
Begin by defining the core task. “Create an interactive calculator for comparing mortgage rates” or “What does this uploaded financial chart show?”
2
Refine the design or focus
If using Artifacts, tell Claude what to change. “Make the buttons blue and add a slider for the deposit amount.” If analysing an image, ask for details. “Focus only on the Q3 revenue dip and give me three possible reasons shown in the data.”
3
Add complexity
Once the foundation is solid, ask Claude to expand. “Now add a chart to the Artifact showing the comparison over 30 years” or “Turn the analysis of this chart into a bulleted summary for an executive.”
Claude’s context window Remembers the previous versions of your Artifacts. If you ask it to make a change and do not like the result, you can use the version history in the Artifact panel to go back, or just ask Claude to revert the last edit.
Try it with your own work
The best way to learn Claude’s visual tools is to use them on a real task. Pick one of the following and spend five minutes experimenting.Digitise your notes
Digitise your notes
Find a handwritten note, a printed agenda, or a photo of a whiteboard from your last meeting. Upload it to Claude and ask: “Please transcribe this text and bold all the action items.”
Build a quick visual mockup
Build a quick visual mockup
Open Claude and ask it to build an interactive Artifact. Try typing: “Create a simple interactive dashboard for tracking team tasks. Use a clean, modern aesthetic.” Play with the buttons it creates!
Get a second opinion on data
Get a second opinion on data
Take a screenshot of a chart or graph you are preparing for a presentation. Upload it and ask Claude: “What is the primary narrative of this chart? Is it easy to understand at a glance?”
Quick checkpoint (you’re done when…)
Use Artifacts
You generated a visual component (like a chart or UI) using Artifacts
Extract text
You uploaded an image and had Claude transcribe or analyse it
Iterate on output
You used follow-up prompts to refine an Artifact or image analysis
Know the limits
You understand what type of attachments Claude accepts
Ready to practice?
Complete the mini challenge to practise using Claude’s visual features