Spreadsheets in ChatGPT
ChatGPT can read, analyse, and visualise data directly from uploaded spreadsheets. When you upload a file, it creates an interactive table view where you can scroll through data, click on specific values, and ask ChatGPT to explain patterns or run calculations.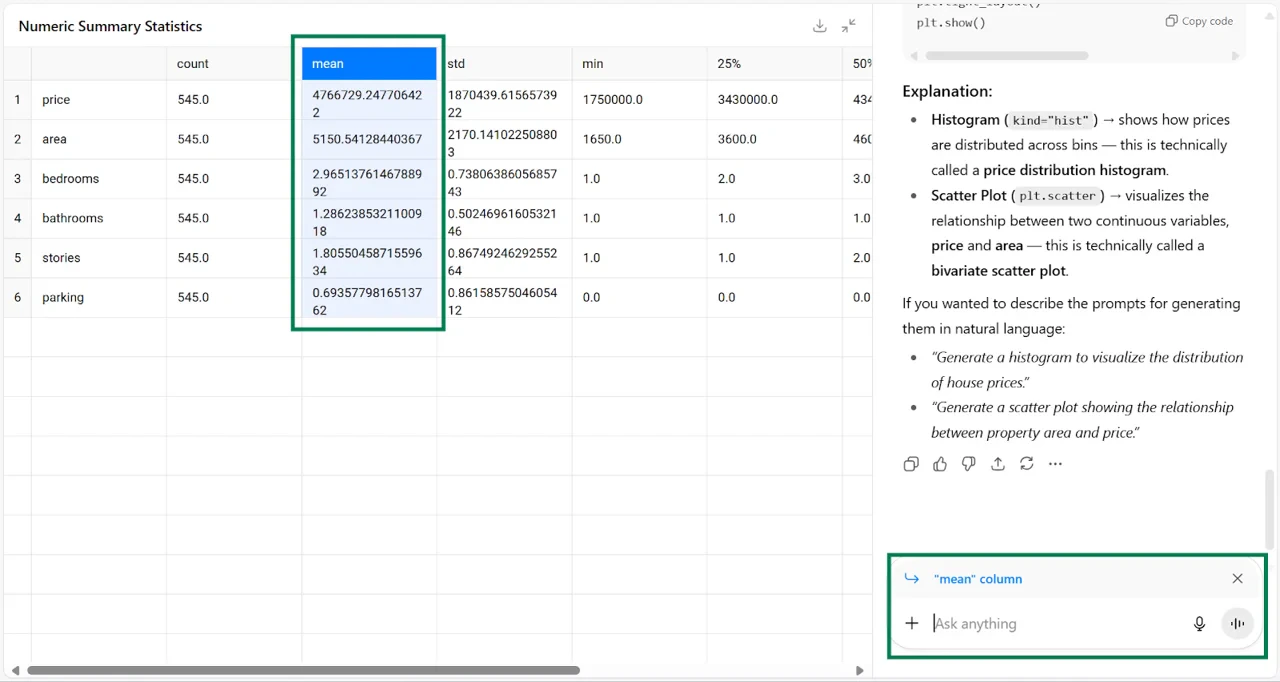
Data analysis and visualisation
ChatGPT handles data exploration, cleaning, and analysis. It reads your columns and rows, interprets what each field represents, and can perform statistical tests and generate forecasts. It also creates interactive charts like histograms and scatter plots.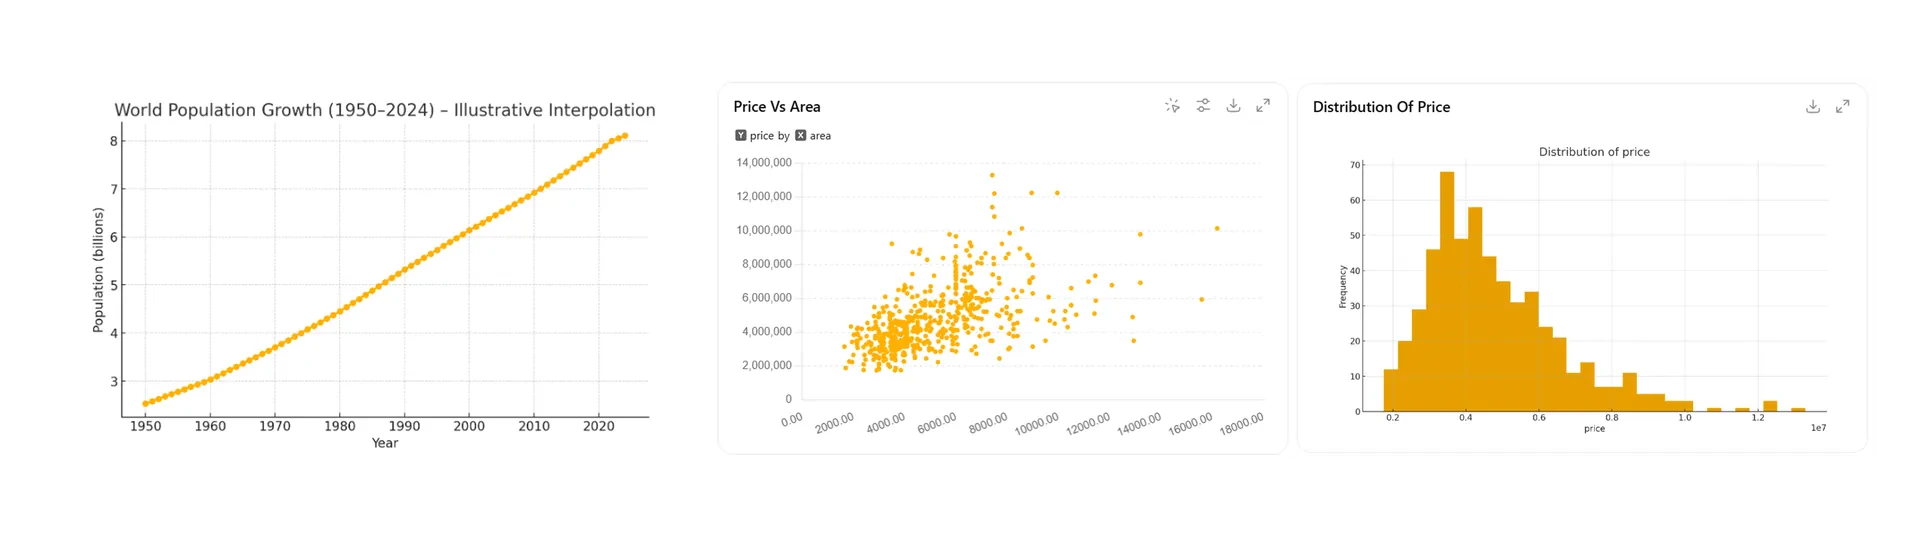
Best practices for spreadsheets
Descriptive labels
Descriptive labels
Use clear headings, not acronyms or jargon. ChatGPT interprets your column names to understand your data.
Simple data
Simple data
One table per sheet. Remove empty rows and columns. If using heavy formulas, providing a CSV or raw data file can help.
Model choice
Model choice
Use GPT-5 Thinking or GPT-5 Pro for complex analysis that involves Python or coding.
File uploads
File uploads
Upload the spreadsheet directly. This tends to be more reliable than using Company Knowledge for data retrieval.
Split prompts
Split prompts
For complex work, prompt one step at a time following the same order you would use manually.
Keep in mind that the Pro model does not support the interactive data view. Use the Thinking mode if you need to explore data visually.